

A cash flow forecast or projection is an essential tool for every business since it helps you manage and plan financial resources.
However, if you have never created one, you may feel overwhelmed by the sheer amount of data you need to input, as well as the process.
Luckily, we’re about to show you how to create a cash flow forecast in Excel and, as a special treat, an alternative way to create cash flow projections.
Let’s dig in!
What is a Cash Flow Forecast?
The cash flow forecast provides valuable financial information and helps you anticipate when you will have a cash surplus or when you’ll need to borrow or use other funding resources.
In addition, it is a decision-making tool that allows you to play with different scenarios to see how certain purchases, expenses, but also inflows will affect your balance.
What Key Components Should Your Cash Flow Forecast Have?
Before you start creating your cash flow forecast, you need to know the basic components that go into it:
✨ Starting or opening cash balance
Refers to the amount of cash you have on hand at the beginning of a specific time period, such as a month or quarter.
It provides a snapshot of the company's current cash position and serves as a reference point for monitoring cash flow throughout the period.
✨ Cash inflows
Represent the money that comes into your financial accounts from a variety of sources, such as sales revenue, investments, loans, etc.
It is crucial for maintaining operations, covering expenses, and ultimately turning a profit.
✨ Cash outflows
Refer to any expenditures or payments that you make during a specified period of time. Therefore, cash outflows can include:
- Payments for salaries and wages,
- Utilities,
- Rent,
- Materials and supplies,
- Debt repayment and any other expenses related to the operation of the business.
One key aspect of managing cash outflows is monitoring payment due dates. This allows you to better plan and allocate your resources to ensure cash liquidity.
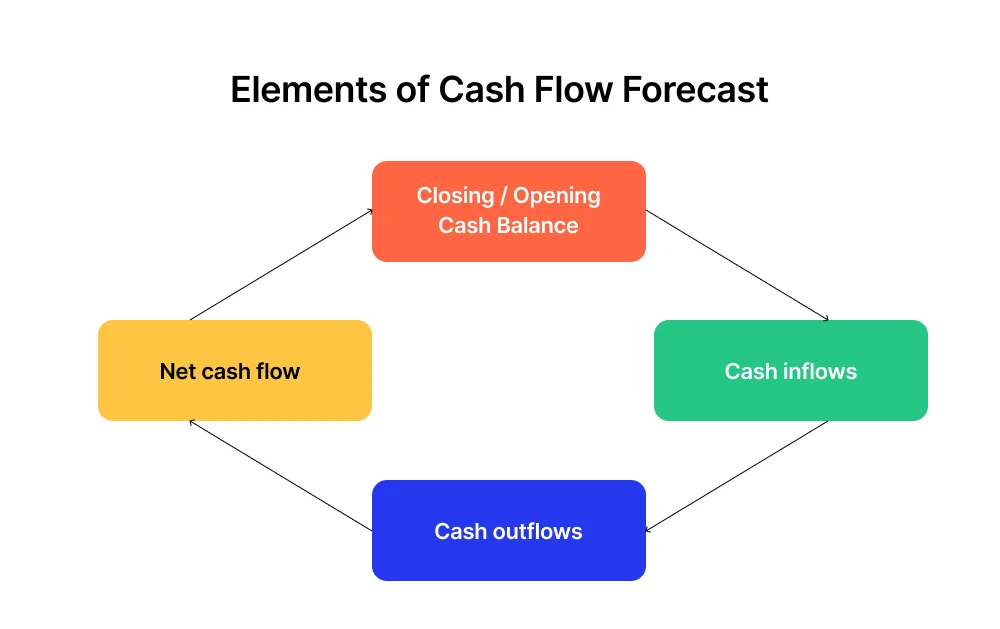
✨ Net cash flow
Shows the difference between the amount of cash coming into your business and the amount of cash going out.
Thus, it indicates how efficiently your company can generate and utilize cash. Overall, you need to consider the cash flows from:
- Operating activities — Cash generated from the core business operations, such as sales revenue and expenses,
- Investing activities — Cash flows related to the purchase or sale of assets, like equipment or investments, and
- Financing activities — Cash flows from borrowing, issuing stock, or paying dividends.
✨ Closing cash balance
Represents the amount of cash on hand at the end of a specific accounting period.
Furthermore, it shows the actual funds available for your business to operate and cover its expenses.
The closing cash balance is actually the opening cash balance for a new forecast period.
How To Create Cash Flow in Excel in 3 Steps?
Now that we’ve covered the key elements of a cash flow forecast let’s show you how to use them in Excel.
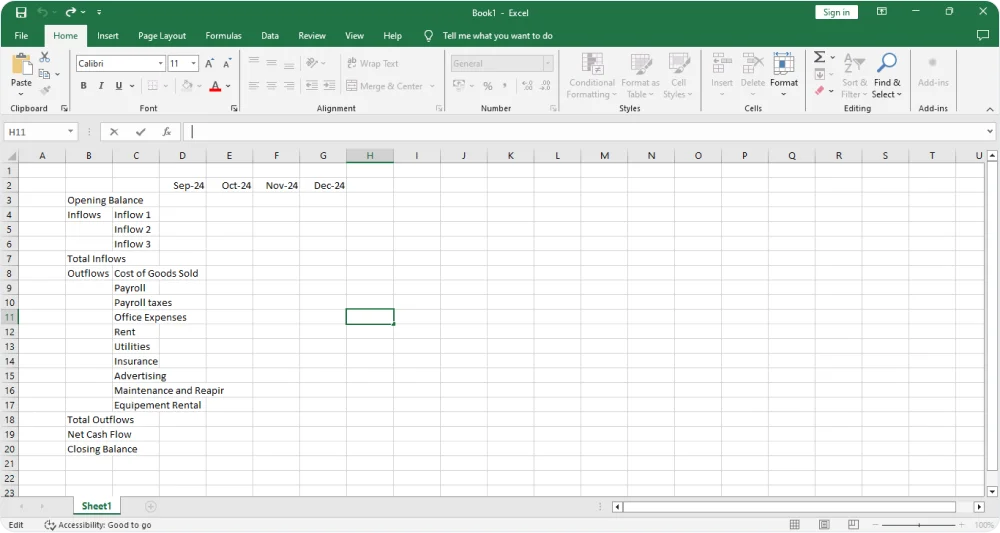
Step 1: Set The Columns
The first step is to set and label your columns. For example, let’s say you want to make a quarterly cash flow forecast.
Enter the months in question and label key elements: starting cash balance, cash inflows and outflows, net cash flow, and closing cash balance.
Your cash inflow and outflow represent your Profit and Loss Statement ( P&L) at the same time.
📌 Note:
When entering your cash inflow and outflow, there is no need to be too granular. For example, if you have 30 items on your P&L, you don’t have to insert each of these.
Why?
For starters, it is really hard to manage it all, and it is tedious.
Furthermore, you are making a forecast, which can never be perfect, but rather show good estimates to move you in the right direction.
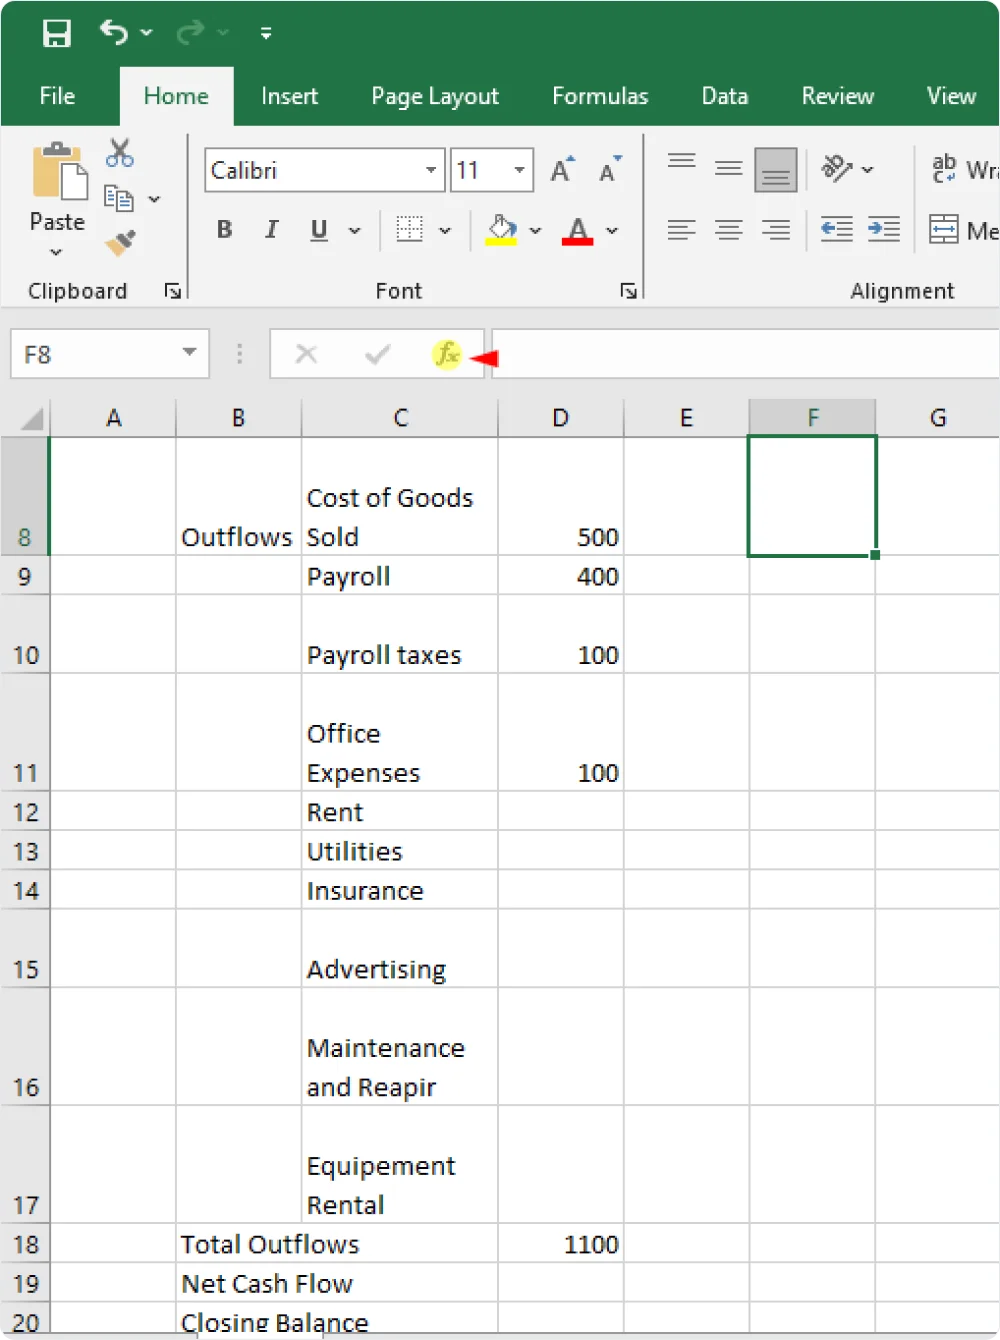
Step 2: Input Data
Naturally, you should start with the Opening Balance and then input cash inflow for the desired month.
Once you’ve done it, click on the fₓ icon in the search bar, and you’ll get a list of functions.
You should click on the “SUM” option for the desired fields. In this case, from D4 to D6.
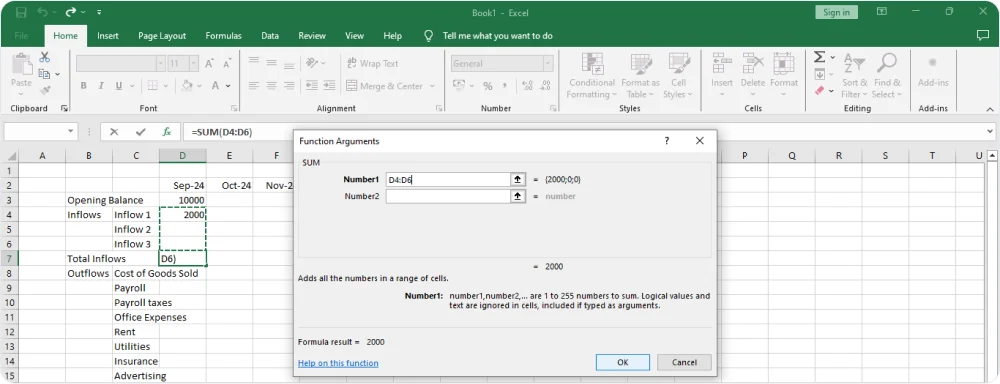
The total inflow will be automatically calculated.
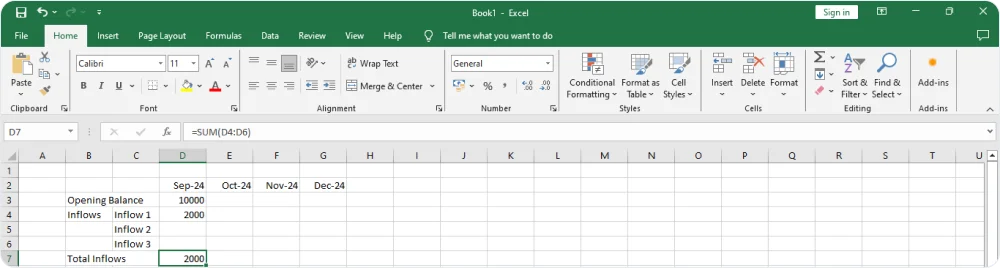
The process is the same for cash outflow. You input the values and use the “SUM” command again — this time for the range D8-D17.
Now, it’s time to calculate the net cash flow, a difference between the total inflows and outflows.
Go to the D19 and enter the following formula: +D7-D18.
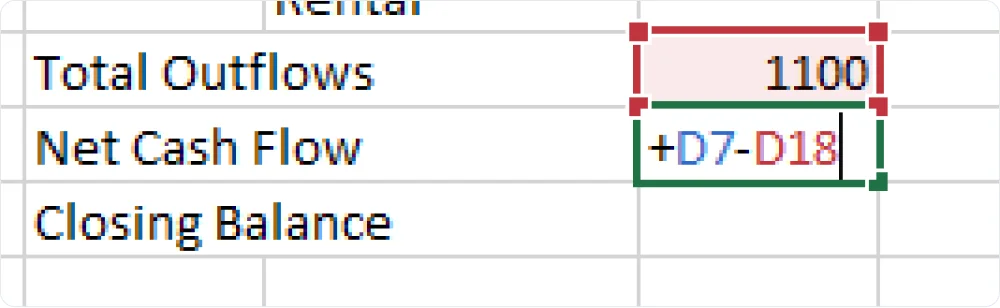
You’ll get the net cash flow value.
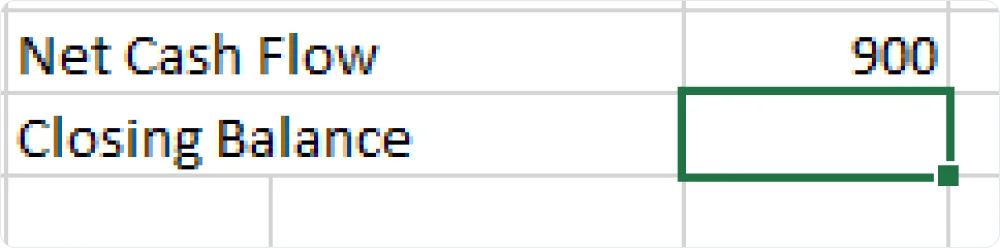
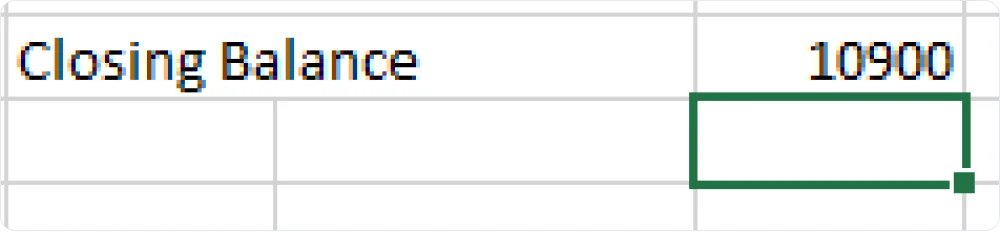
The final thing left to do is to calculate the Closing balance. It represents the sum of the opening balance for the desired month and the net cash flow of the same month.
Thus, in our example, it would be +D3+D19.
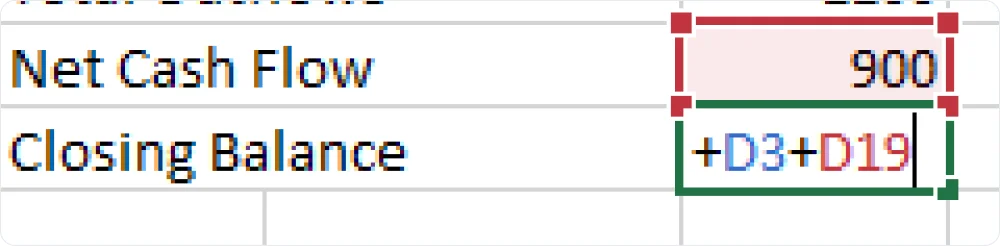
The closing balance is 10900, which at the same time represents the opening balance for the following month.
📌 Note:
You should also include the Profit & Loss Statement, a Balance Sheet, and a Cash Flow Statement in your cash flow forecast.
Each tackles different aspects, and you need to consider all of them for a more precise projection.
Step 3: Format Your Cash Flow Forecast
In order to make your cash flow forecast easier to navigate and with a “tidier” look, you can apply colors to certain fields and use different fonts or font colors.
There is really no wrong way to do it. Just pay attention not to make it overwhelming with colors or too many different fonts.
Here are a few suggestions:
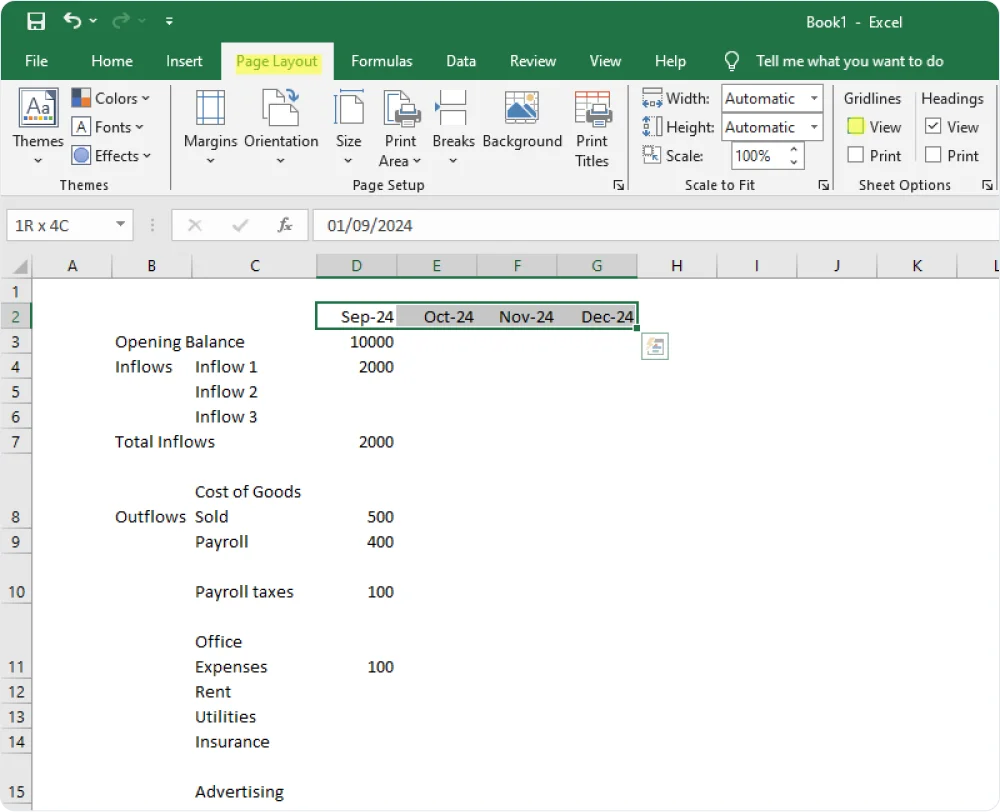
- If you want to remove the gridlines, go to the Page Layout section and untick the Grid View.
- For months columns, you can use bolding, change the background color, center the text, and apply the All Borders option.
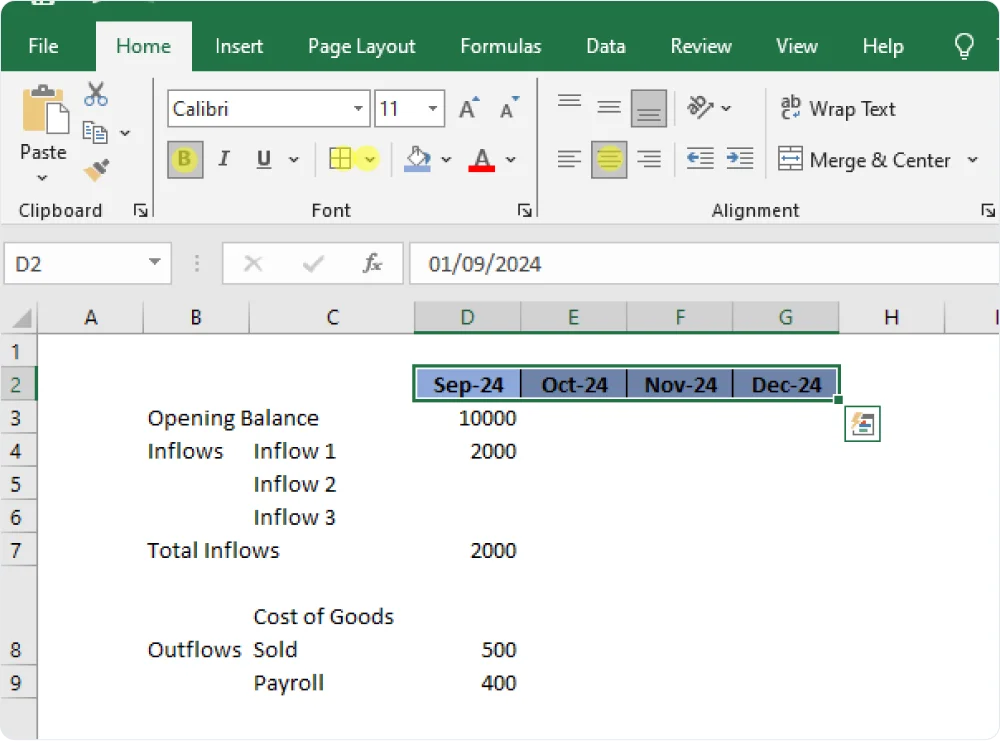
- You can apply the same principle to other relevant fields, such as Opening or Closing balances, Inflows, etc.
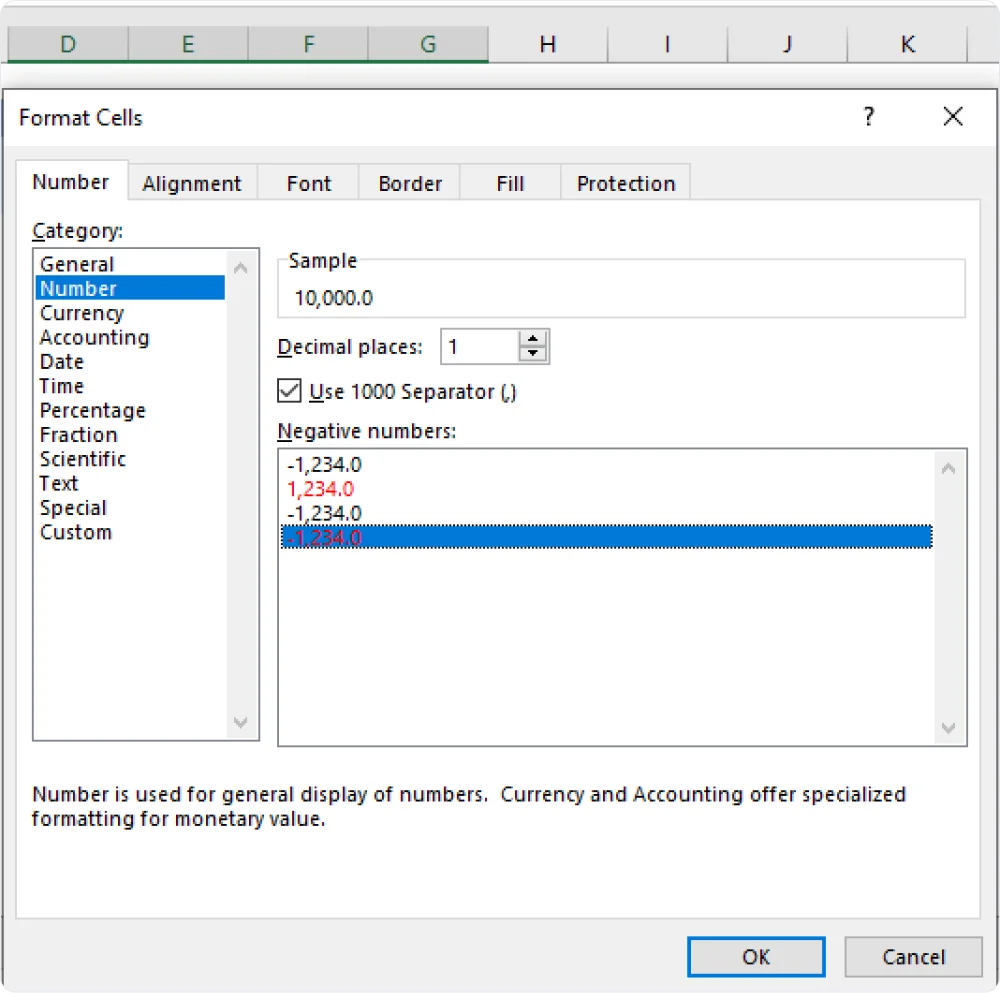
- When it comes to numbers, you can also set that the negative numbers appear in red, with a minus sign in front of them.
- Select all the number fields and right-click. When you see the menu pop-up, go to the Format Cells option.
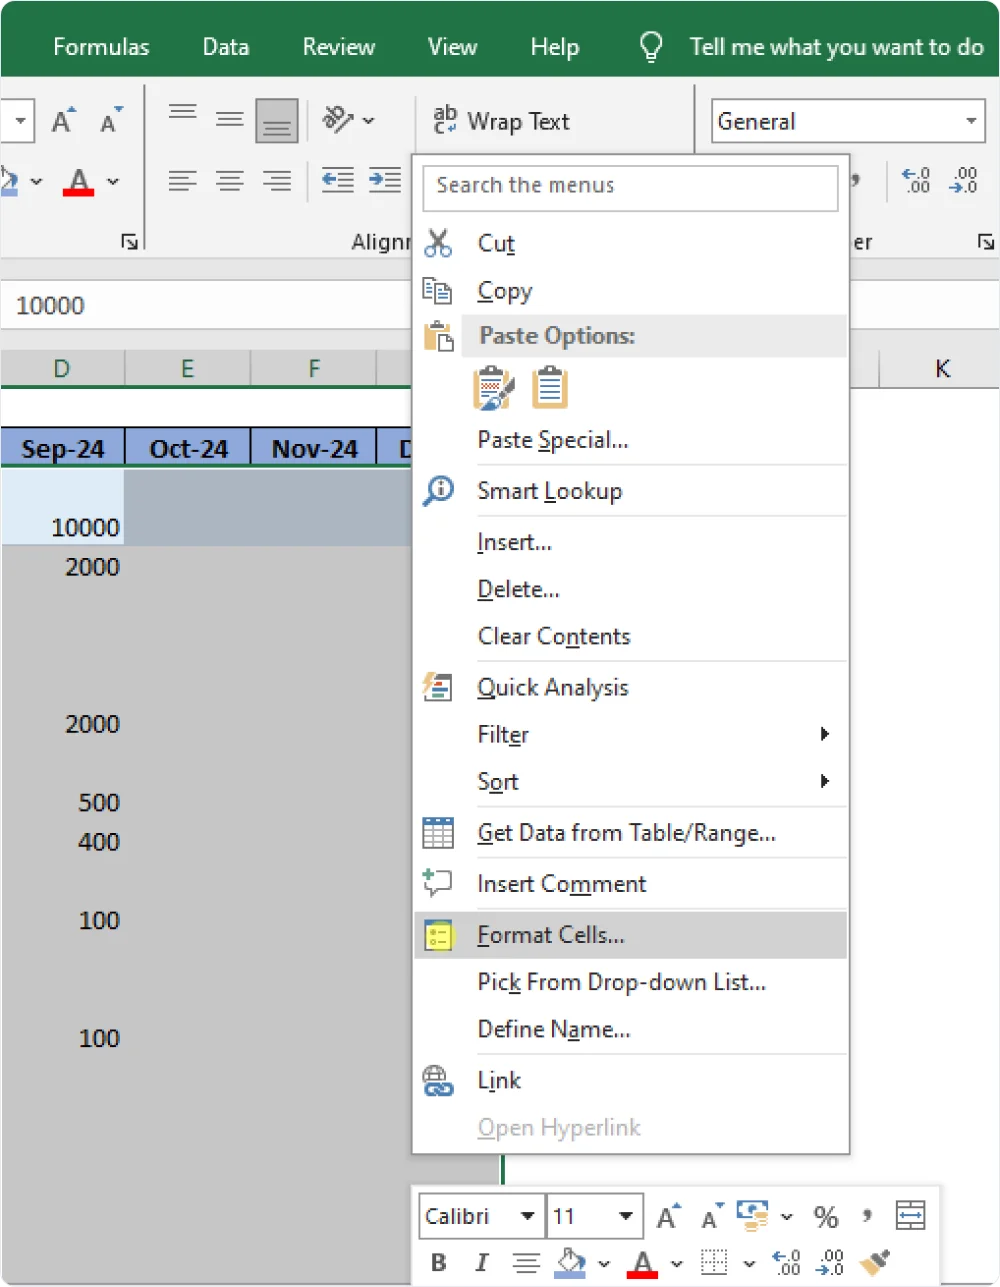
- Choose the Number Option and
- Set the Decimal Places to 1,
- Tick the Use 1000 Separator and
- Click on the red negative number with the minus sign.
- Then click OK.
What Excel Operations Should You Know About to Create a Cash Flow Forecast?
Besides the SUM function, there are a few other operations that are handy regarding Excel cash flow forecast and its analysis.
1. The IF Function
The IF formula helps you create various scenarios or, better yet, see the possible outcomes if a certain variable changes.
For example, you can use it to see how buying new equipment will affect your cash flow, etc.
🔎 Formula: =IF(logical_test, value_if_true, value_if_false)
👉 Example:
Let's say you have a table of cash inflows and outflows, and you want to calculate the net cash flow and determine if it is positive or negative.
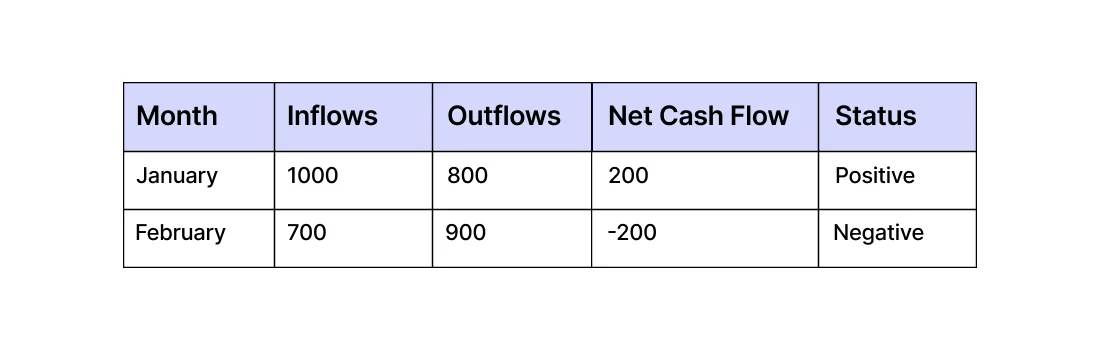
Formulas to use:
- Net Cash Flow: In cell D2, you can calculate the net cash flow with =B2 - C2
- Status (Positive/Negative): In cell E2, use the IF function to determine the status =IF(D2 >= 0, "Positive", "Negative")
You can drag these formulas down to fill the other cells in columns D and E for subsequent months.
2. The SUMIF Function
This function calculates a range of numbers based on a set of criteria, and you can use it to add up sales figures or calculate a budget.
If you are tracking sales figures for different products, you could use the SUMIF function to calculate the total sales for a particular product category.
Or, if you are managing a budget, you could use the function to calculate the total expenses for a specific department or project.
🔎 Formula: =SUMIF(range, criteria, [sum_range])
👉 Example: Suppose you have a table of expense data with departments or projects and expense amounts.
And let’s assume you want to calculate the total expenses for a specific department, such as "Marketing".
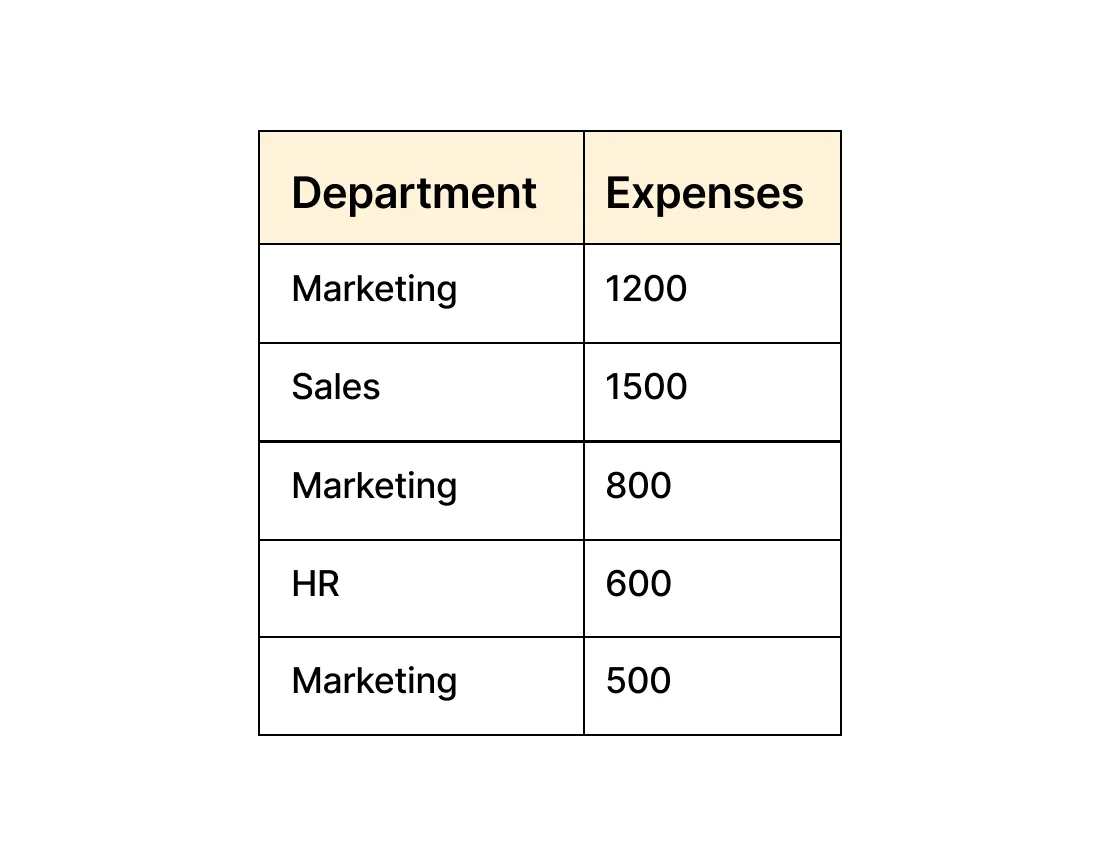
To calculate the total expenses for the "Marketing" department, use the SUMIF function: =SUMIF(A2:A6, "Marketing", B2:B6)
This formula sums up the values in column B (Expenses) where the corresponding value in column A (Department) is "Marketing".
3. The NPV (Net Present Value) Function
The NPV calculates the present value of future cash flows for an investment or project.
Thus, it helps investors determine the profitability and feasibility of an investment decision.
You can also use it to compare different investment opportunities and prioritize projects based on their potential returns.
🔎 Formula: =NPV(discount_rate, value1, [value2], ...)
👉 Example: Let's say you have a series of cash flows over five years and a discount rate of 10%. The initial investment is $5,000, and the expected cash flows are as follows:

To calculate the NPV, you can use the following formula in Excel: =NPV(0.10, B2:B6) + B1
Here, B2:B6 contains the cash flows for years 1 to 5, and B1 contains the initial investment (which should be added separately as it is already at present value).
4. The IRR (Internal Rate of Return) Function
The IRR evaluates the profitability of an investment and calculates the rate of return at which the net present value of an investment is equal to zero.
In simpler terms, the IRR is the discount rate that makes the present value of the cash inflows equal to the present value of the cash outflows.
It helps investors and financial analysts determine whether an investment has the potential to generate a satisfactory return.
By comparing the IRR of different projects, companies can prioritize which investments are most likely to yield the highest returns and make informed financial decisions.
🔎 Formula: =IRR(values, [guess])
👉 Example: Let's say you have the same series of cash flows over five years as in the NPV example.
To calculate the IRR, use the following formula in Excel: =IRR(B1:B6), and place it in cell B7.
Analyze Cash Flow Forecast Data with Sensitivity Analysis
When assessing the strength and reliability of your cash flow model, it is crucial to do a sensitivity analysis to identify potential vulnerabilities and risks.
By stress-testing your cash flow model, you can determine how sensitive it is to various factors such as:
- Changes in market conditions,
- Unexpected events, and
- Fluctuations in variables like interest rates or exchange rates.
Sensitivity analysis involves adjusting key variables in your cash flow model to simulate different scenarios and evaluate their impact on the overall financial health of your business.
As a result, you can better understand how resilient your cash flow model is under different circumstances, allowing you to make informed decisions.
Furthermore, it also helps you develop contingency plans to mitigate potential risks.
How Can Puls Project Automate Your Cash Flow Forecast?
Creating a cash flow forecast from scratch is time consuming and prone to errors, especially if you are new to Excel and overloaded with simple and complex formulas.
Puls Project doesn’t only help you automate cash flow forecasts, but it also provides assets to help you distribute your cash better and overcome cash shortage.
Our FinTech solution allows you to:
💎 Manage and track all your balances and spending across different accounts and companies from a centralized dashboard.

💎 Automate expense tracking by inputting your regular monthly expenses once, and have them automatically displayed the following month.
💎 Monitor your cash flow actively, and we’ll inform you if our tool detects a cash gap so that you can make necessary adjustments.
💎 Categorize financial activities across multiple banks and companies and assign labels to transactions for easier expense tracking, spending optimization, etc.

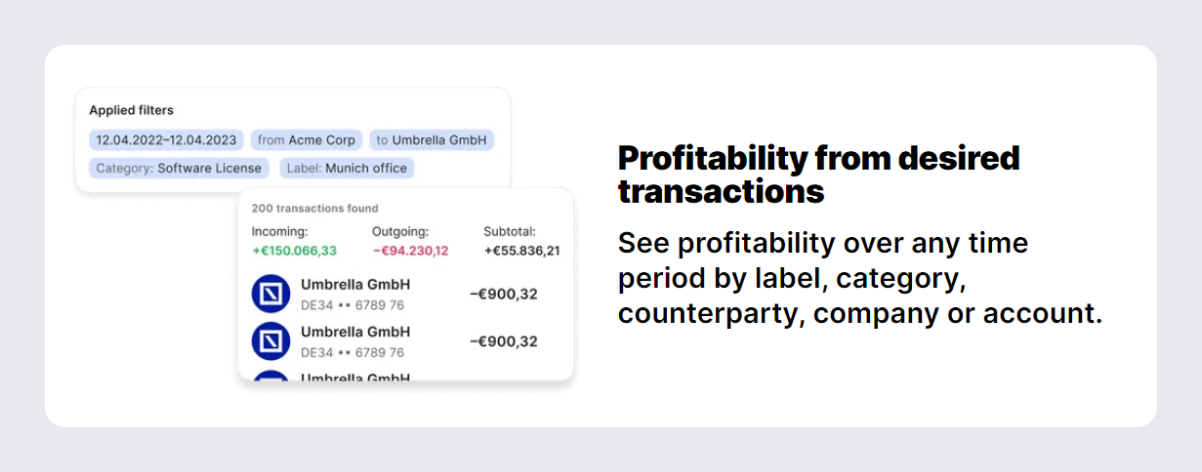
💎 Track profitability and analyze it by label, category, counterparty, company, or account.
💎 View balances of all accounts in one place, manage invoice payments efficiently, and maintain a clear history of payments.

In addition, our tool allows you to securely connect multiple bank accounts from over 4000 German banks to our platform and enhance your credit limits.
💎 Thus, you can receive up to €10,000 within 48 hours and use the loan to close cash gaps or to make an investment.
Enticed to give it a go?
Sign up for Puls Project and forget about manual cash flow forecast creations.
Keep Learning:
8 Key Benefits of Cash Flow Forecast


